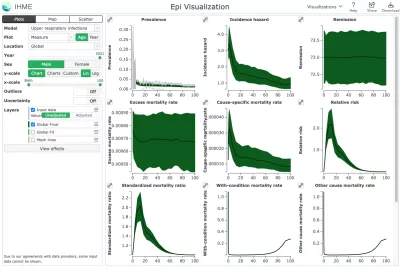
With this interactive tool, you can explore data inputs and epidemiological estimates from the GBD 2021 study. Estimates of nonfatal health loss for the majority of diseases, and exposure estimates for many risk factors, was modeled using DisMod-MR 2.1, a Bayesian mixed-effects meta-regression modeling tool developed for GBD analyses. Initial estimates are made at the global level then sequentially revised down to the national and subnational levels using data that are progressively more detailed with respect to geography and time. Select any condition that was modeled using DisMod-MR 2.1, visualizing the pre- and post-adjusted incidence, prevalence, mortality, and remission data across hundreds of conditions in 204 countries and territories from 1990 to 2021. Model results estimated using other methods are also available for causes, risk factors, and impairments. Input data are available for download via the visualization for models using DisMod-MR.
Terms and conditions of use
For terms and conditions of use, please visit http://www.healthdata.org/about/terms-and-conditions.
Definitions
- Prevalence (expressed as a proportion): The number of cases in a population at a moment in time
- Incidence (expressed as a rate): The number of new cases per person-year; often approximated by taking the number of new cases in a year divided by the midyear population
- Remission (expressed as a rate): The number of cases that resolve or are cured per person-year
- Excess mortality rate (expressed as a rate): The number of excess deaths per person-year among prevalent cases
- Relative risk (expressed as a rate ratio): The mortality rate in the diseased compared to the mortality rate in the non-diseased population
- Standardized mortality ratio (expressed as a rate ratio): The mortality rate in the diseased compared to the mortality rate in the entire population
- With-condition mortality rate (expressed as a rate): Total number of deaths among prevalent cases in a year of interest. It is equivalent to the sum of other cause mortality rate and cause-specific mortality rate
- Cause-specific mortality rate (expressed as a rate): The number of deaths due to the condition per person-year among the entire population; equivalent to prevalence multiplied by excess mortality
- Proportion (expressed as a proportion): The number of cases with a certain characteristic in a population (e.g., the proportion of HIV that is due to sexual transmission or the proportion of households using solid fuels for cooking)
- Continuous (expressed as a number): A population characteristic that is measured on a continuous scale (e.g., the mean level of blood pressure or body mass index)
- Global fit: Initial estimate fit to all the world’s data with estimation of the coefficients to crosswalk data with non-reference study characteristics (e.g., different case definition or one-year prevalence instead of point prevalence)
- Super-region prior: Global fit estimates added at next level of cascade as “prior” knowledge to be evaluated with data from the super-region
- Super-region fit: Estimate for super-region
- Region prior: Super-region estimates added as “prior” knowledge to be evaluated with data from the region
- Region fit: Estimate for region
- Country prior: Region estimates added as “prior” knowledge to be evaluated with data from the country
- Country fit: Estimate for country
- Country final: Summation of all subnational fits; if no subnational units, country fit and country final are identical
- Region final: Summation of all country final results
- Super-region final: Summation of all region final results
- Global final: Summation of all super-region final results
Citation
Institute for Health Metrics and Evaluation (IHME). Epi Visualization. Seattle, WA: IHME, University of Washington, 2024. Available http://vizhub.healthdata.org/epi. (Accessed [INSERT DATE])
Browser notes
- Use the latest version of Chrome, Edge, Safari, or Firefox.
- Use Ctrl+0 to reset the browser zoom. Sometimes having the browser zoomed in or out interferes with the layout or a few mouse-dependent properties.
- If the visualization isn't loading or looks distorted, try clearing your cache. See http://www.wikihow.com/Clear-Your-Browser's-Cache for pointers.